We are very enthusiastic about the results we’re going to show you, said Professor Pieternel Levelt (KNMI/TU Delft). Together with Dr Pepijn Veefkind (KNMI/TU Delft), she gave a preview of the Tropomi satellite images in the civil engineering building last Thursday.
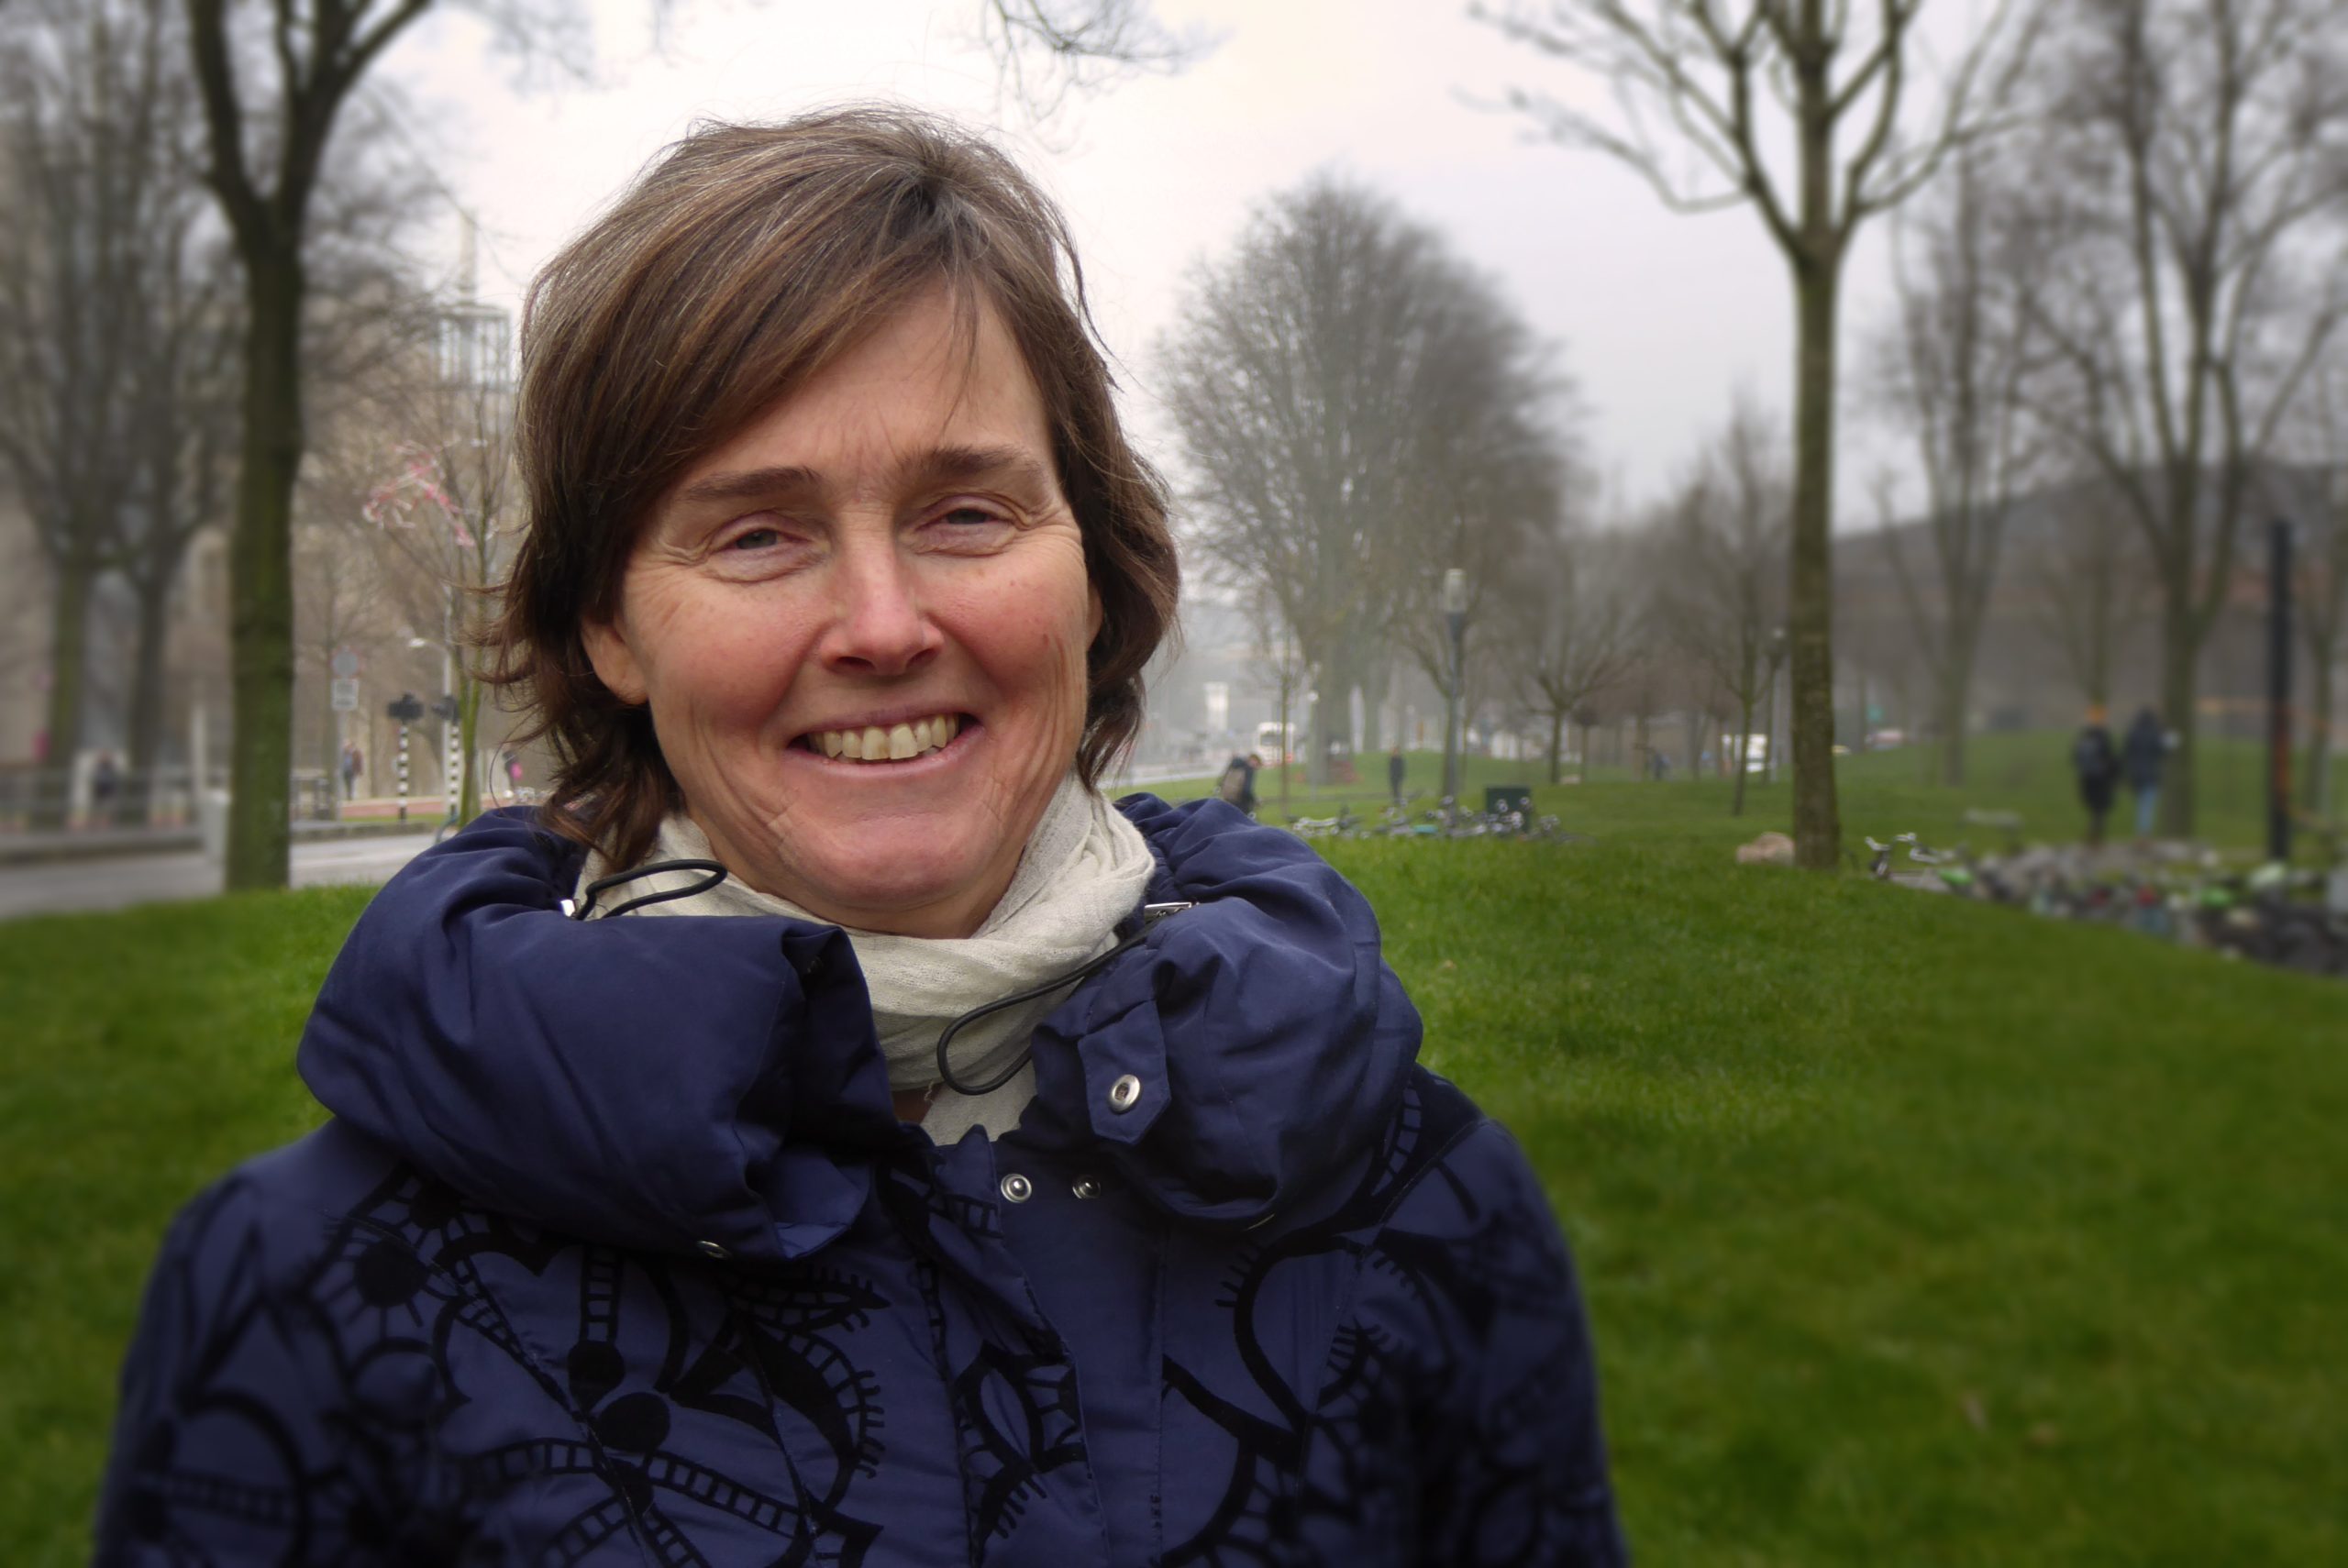
Prof. Pieternel Levelt (KNMI / TU Delft). (Photo: JW)
The first image they saw coming in showed the air pollution over Europe. They zoomed in, making use of the unprecedented resolution of 3.5 by 7 kilometres, and saw plumes of smoke extending over the continent. Until then, plumes of air pollution were theoretical. Now, for the first time ever, the Tropomi satellite had made them real.
The researchers are still fine-tuning the five instruments on board Tropomi, which monitor 4000 wavelengths simultaneously, stretching from ultraviolet into the far infrared, producing 225 gigabytes of raw data every day. Oil refineries, heavy industry, coal-fired power plants, and forest fires all clearly emerge. Tropomi monitors the entire atmosphere, day by day.
Professor Pieternel Levelt was available for an interview after the presentation.
We’ve just seen the Tropomi images, which were quite impressive in showing plumes of air pollution. What societal impact do you expect these images will have?
“I think the first societal impact was from the OMI and SCIAMACHY images back in 2004. These images showing air pollution were used by the political party Groen Links in its election campaign. People then saw for the first time how pollution behaves around the world. Do I expect a comparable impact this time as well? I think that the images may make people aware for the first time how air pollution is distributed across Europe. But people working in the field are well aware of where these sources of pollution are located, and where the air is cleaner. What I expect to happen, although it will take time, is that satellite data will be used to see if our emission measures are effective. At this point in time, satellite data are not used yet formally. For the ozone layer, for the Montreal protocol, satellite data are used. But for pollution, being a relatively new area, satellite data are not yet being used. But I think that will change in 10-20 years’ time.”
Will that be thanks to the Tropomi images?
“Yes, and also to the fact that we now have an operational system. That means that you always have an instrument in place that monitors the chemical trace gases in the atmosphere. We started with more research-oriented instruments, but now with Tropomi, being part of the Copernicus set, we know that the Sentinel 5 satellite, of which there will be built three, will follow Tropomi. That means that there will be continuity, and that means that you can use satellites to monitor long-term changes and the effectiveness of policies.”
So the awareness was already there, but Tropomi and Sentinels will put a means for monitoring environmental policies in place?
“The satellites allow one to see if the policies are effective. But satellites are not the only means to measure air pollution. You also have to measure at ground level. Satellite images are an add-on that shows how air pollution moves through the atmosphere. Pollution from one country freely moves over other countries as well. The fact that one instrument measures the entire globe enables comparisons to be made. That is much more difficult with ground-based instrumentation.”
Your colleague, Dr Pepijn Veefkind, also expected air quality forecasts to be improved with the Tropomi data?
“I think that is another important impact that might even be put in place earlier. We already have the Copernicus Atmospheric Monitoring System that uses several sources of satellite data, including OMI, but now they will also include Tropomi data as well. The air quality system for Europe is actually providing the basic starting information for the Dutch air quality model, as is used by our colleagues from the RIVM environmental agency for their air quality forecast.”
To conclude, how come it is Dutch research that is leading in atmospheric monitoring?
“I think there are a few essential factors. The Netherlands has top designers and instrument builders for optical systems. We have an industry that can build these types of instruments. We also have scientists capable of leading this type of effort. And since the Netherlands is not that big, we are always close to each other, making collaboration easier. Managing the interfaces and understanding each other are important aspects of this kind of work. We can come together easily and we are good in teamwork.”
How come we focus these capabilities on environmental monitoring?
“I think that the Dutch are well aware of the importance of environmental issues. We have a high population density that results in the production of more pollution that we have to deal with. We have built up our expertise in environmental satellites from the early 1990s. Actually, the original idea to measure the chemical composition of the atmosphere came from Paul Crutzen, who won the Nobel Prize in 1987 for his discovery of the hole in the ozone layer.”
Further information on:
Heb je een vraag of opmerking over dit artikel?
j.w.wassink@tudelft.nl


Comments are closed.