Fluid dynamicist Dr Koen Muller filmed fish at Blijdorp Zoo. Not for a family video, but for his PhD research. It turned out it wasn’t as easy as shooting fish in a barrel.
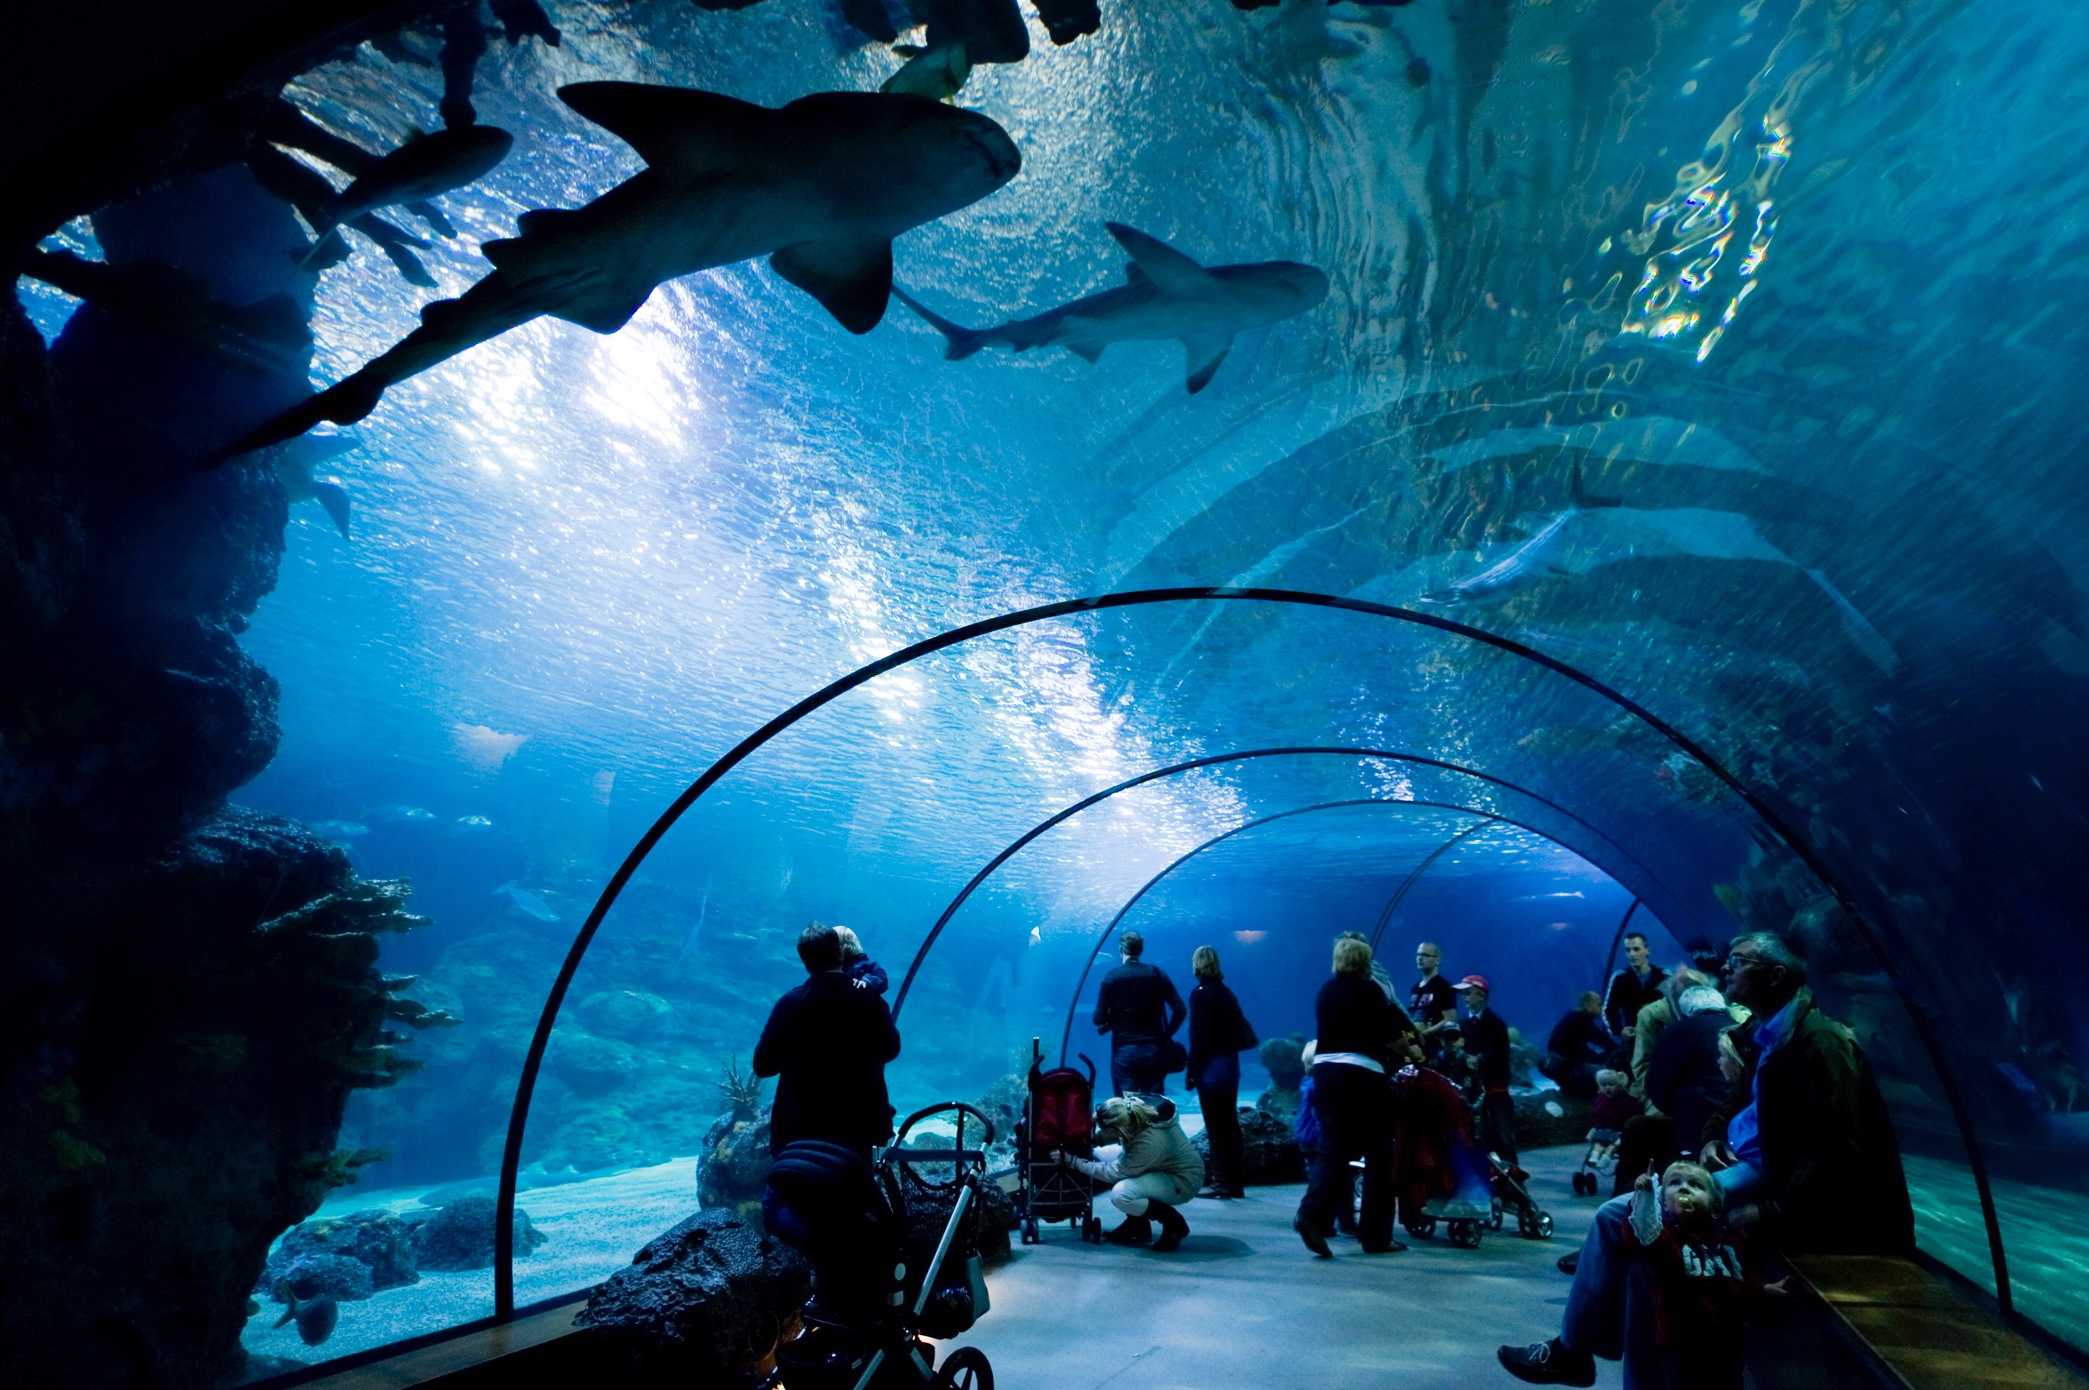
This cavernous tunnel in a huge aquarium filled with sharks and barracuda seems like the secret lair of a James Bond villain. It is, in fact, Blijdorp Zoo’s shark tank. (Photo: Blijdorp Zoo)
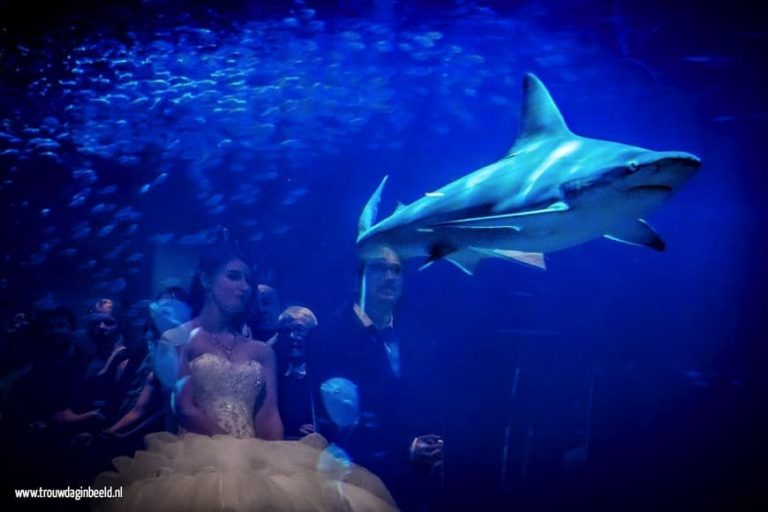 This newlywed couple gazes out at one of the aquarium’s sharks—certainly not your average wedding crasher. (Photo: Arno de Bruijn)
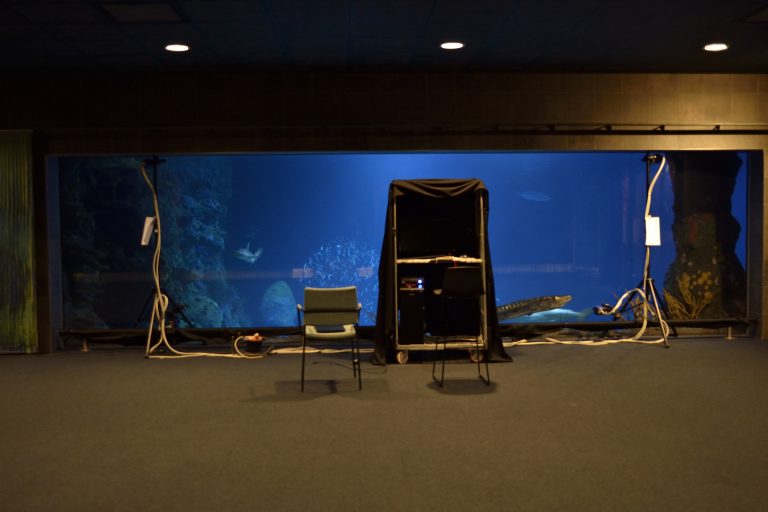 The cameras mounted at the window, featuring a curious barracuda peeking into the room. (Photo: Koen Muller)
There’s not plenty of fish studies in the sea
Large-scale field experiments that acquired quantitative data from the imaging of large cohesive groups of animals moving naturally through a fluid are a novel and important development in the interdisciplinary fields of fluid dynamics and ethology (the study of animal behaviour). Only a few studies like Koen’s have been carried out. (One example: large-scale Lagrangian tracking of bats and bird flocks.) Certainly none had involved the application of three-dimensional image processing of a few thousand fish.
“The scale is quite unique. There is no other comparable experiment…You’re touching so close upon what would happen in the real world.“, explains Daniel Tam, Koen’s PHD supervisor. Koen added: “We had to push the limit of experimental methods. It was like, okay, ‘can we even do this? Is it possible?’”
English only
For his dissertation on the schooling behaviour of false herring in a realistic environment, Koen Muller set up four video cameras at the Oceanium, the huge shark tank at Blijdorp Zoo in Rotterdam. The experiment ended up being a Herculean task. He had to keep track of each individual fish in a swirling school of 2,000 while dealing not only with various optical reflections and distortions from the water/glass/air interfaces but also with the constant photobombing of other marine life in the aquarium. Delta spoke with Muller about this data-gathering tour de force.
Fishnadoes are fluid
Muller is a fluid dynamicist, so you may find it a bit fishy that he was interested in tracking false herring (a Harengula herring species) in a shark tank. The reason is the same as that which lay behind Muller’s master’s degree research involving the movement of microscopic algae within a tiny volume: complex systems of interacting entities in motion – algae, fish, even human beings – can be usefully modelled as fluid particles. When Koen first saw the false herring in the tank, he didn’t see a school of fish; he saw a ‘fish tornado’.
The ‘fishnado’ in question. School is in session, but the predators are not enrolled! Besides the Harengula, the shark tank is home to several predatory shark species, namely the blacknose, nurse, sandbar and blacktip varieties. There are also barracudas, tarpons and tuna among other hunting fish. Co-habitant species include stingrays and sea turtles. (Video: Koen Muller)
Still, the analogy between the bulk movement of fish and that of fluids goes only so far. There must be other factors at play between fish that cannot be modelled like pressure, viscosity or diffusion. Muller explains. “If you think about dispersion of particles and fluids, that they will stay in one group is completely counter-intuitive. And so there are behavioural rules that we could discover with three-dimensional tracking data, that make the school a cohesive group.”
‘We had to push the limit of experimental methods’
One of the behaviours that Muller was hoping to unravel was the false herrings’ collective response to an approaching predator. This fish behaviour had been described qualitatively in scientific literature, but never quantitatively. Thus, Muller intended to observe the false herring, both in the absence of predatory threats and when predators approached or swam through the school, taking precise measurements of the fish positions relative to one another and the predator.
Muller was given access to the zoo’s conference room, which features the shark tank as a backdrop through a large, flat 2 m x 8 m glass panel. This scenic room is normally rented out to businesses for conferences, or even to couples for private wedding ceremonies and receptions. Four video cameras, each mounted at a corner of the rectangular window, recorded individual fish motion throughout an impressive 10 m x 25 m x 6 m chunk of the aquarium.
 This newlywed couple gazes out at one of the aquarium’s sharks—certainly not your average wedding crasher. (Photo: Arno de Bruijn)
There are not plenty of fish studies in the sea
Large-scale field experiments acquiring quantitative data from the imaging of large cohesive groups of animals moving naturally through a fluid are a novel and important development in the interdisciplinary fields of fluid dynamics and ethology (the study of animal behaviour). Only a few studies like Muller’s have been carried out. (One example: large-scale Lagrangian tracking of bats and bird flocks.) Certainly none had involved the application of three-dimensional image processing of a few thousand fish.
“The scale is quite unique. There is no other comparable experiment. You’re touching so close upon what would happen in the real world,” explains Daniel Tam, Muller’s PhD supervisor. Muller added: “We had to push the limit of experimental methods. We thought ‘can we even do this? Is it possible?’”
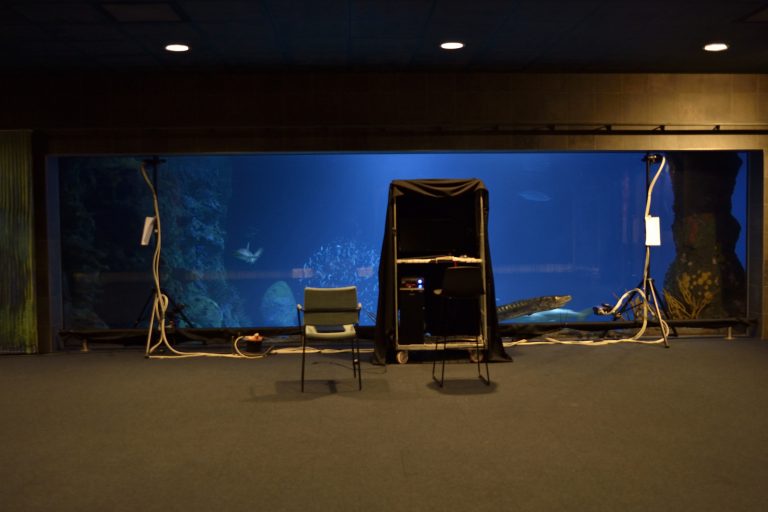 The cameras mounted at the window, featuring a curious barracuda peeking into the room. (Photo: Koen Muller)
Lights, camera, and … distraction
The fish tank contained not only false herring and sharks. It contained barracudas, turtles and many other marine creatures that often intruded into the camera’s view. One barracuda was especially obnoxious, recalls Muller. “I had, let’s say, some ‘involvement’ with this fish in particular, because this one would actually block my view. So I had to wait until the fish would go away, and then I could resume taking data.”
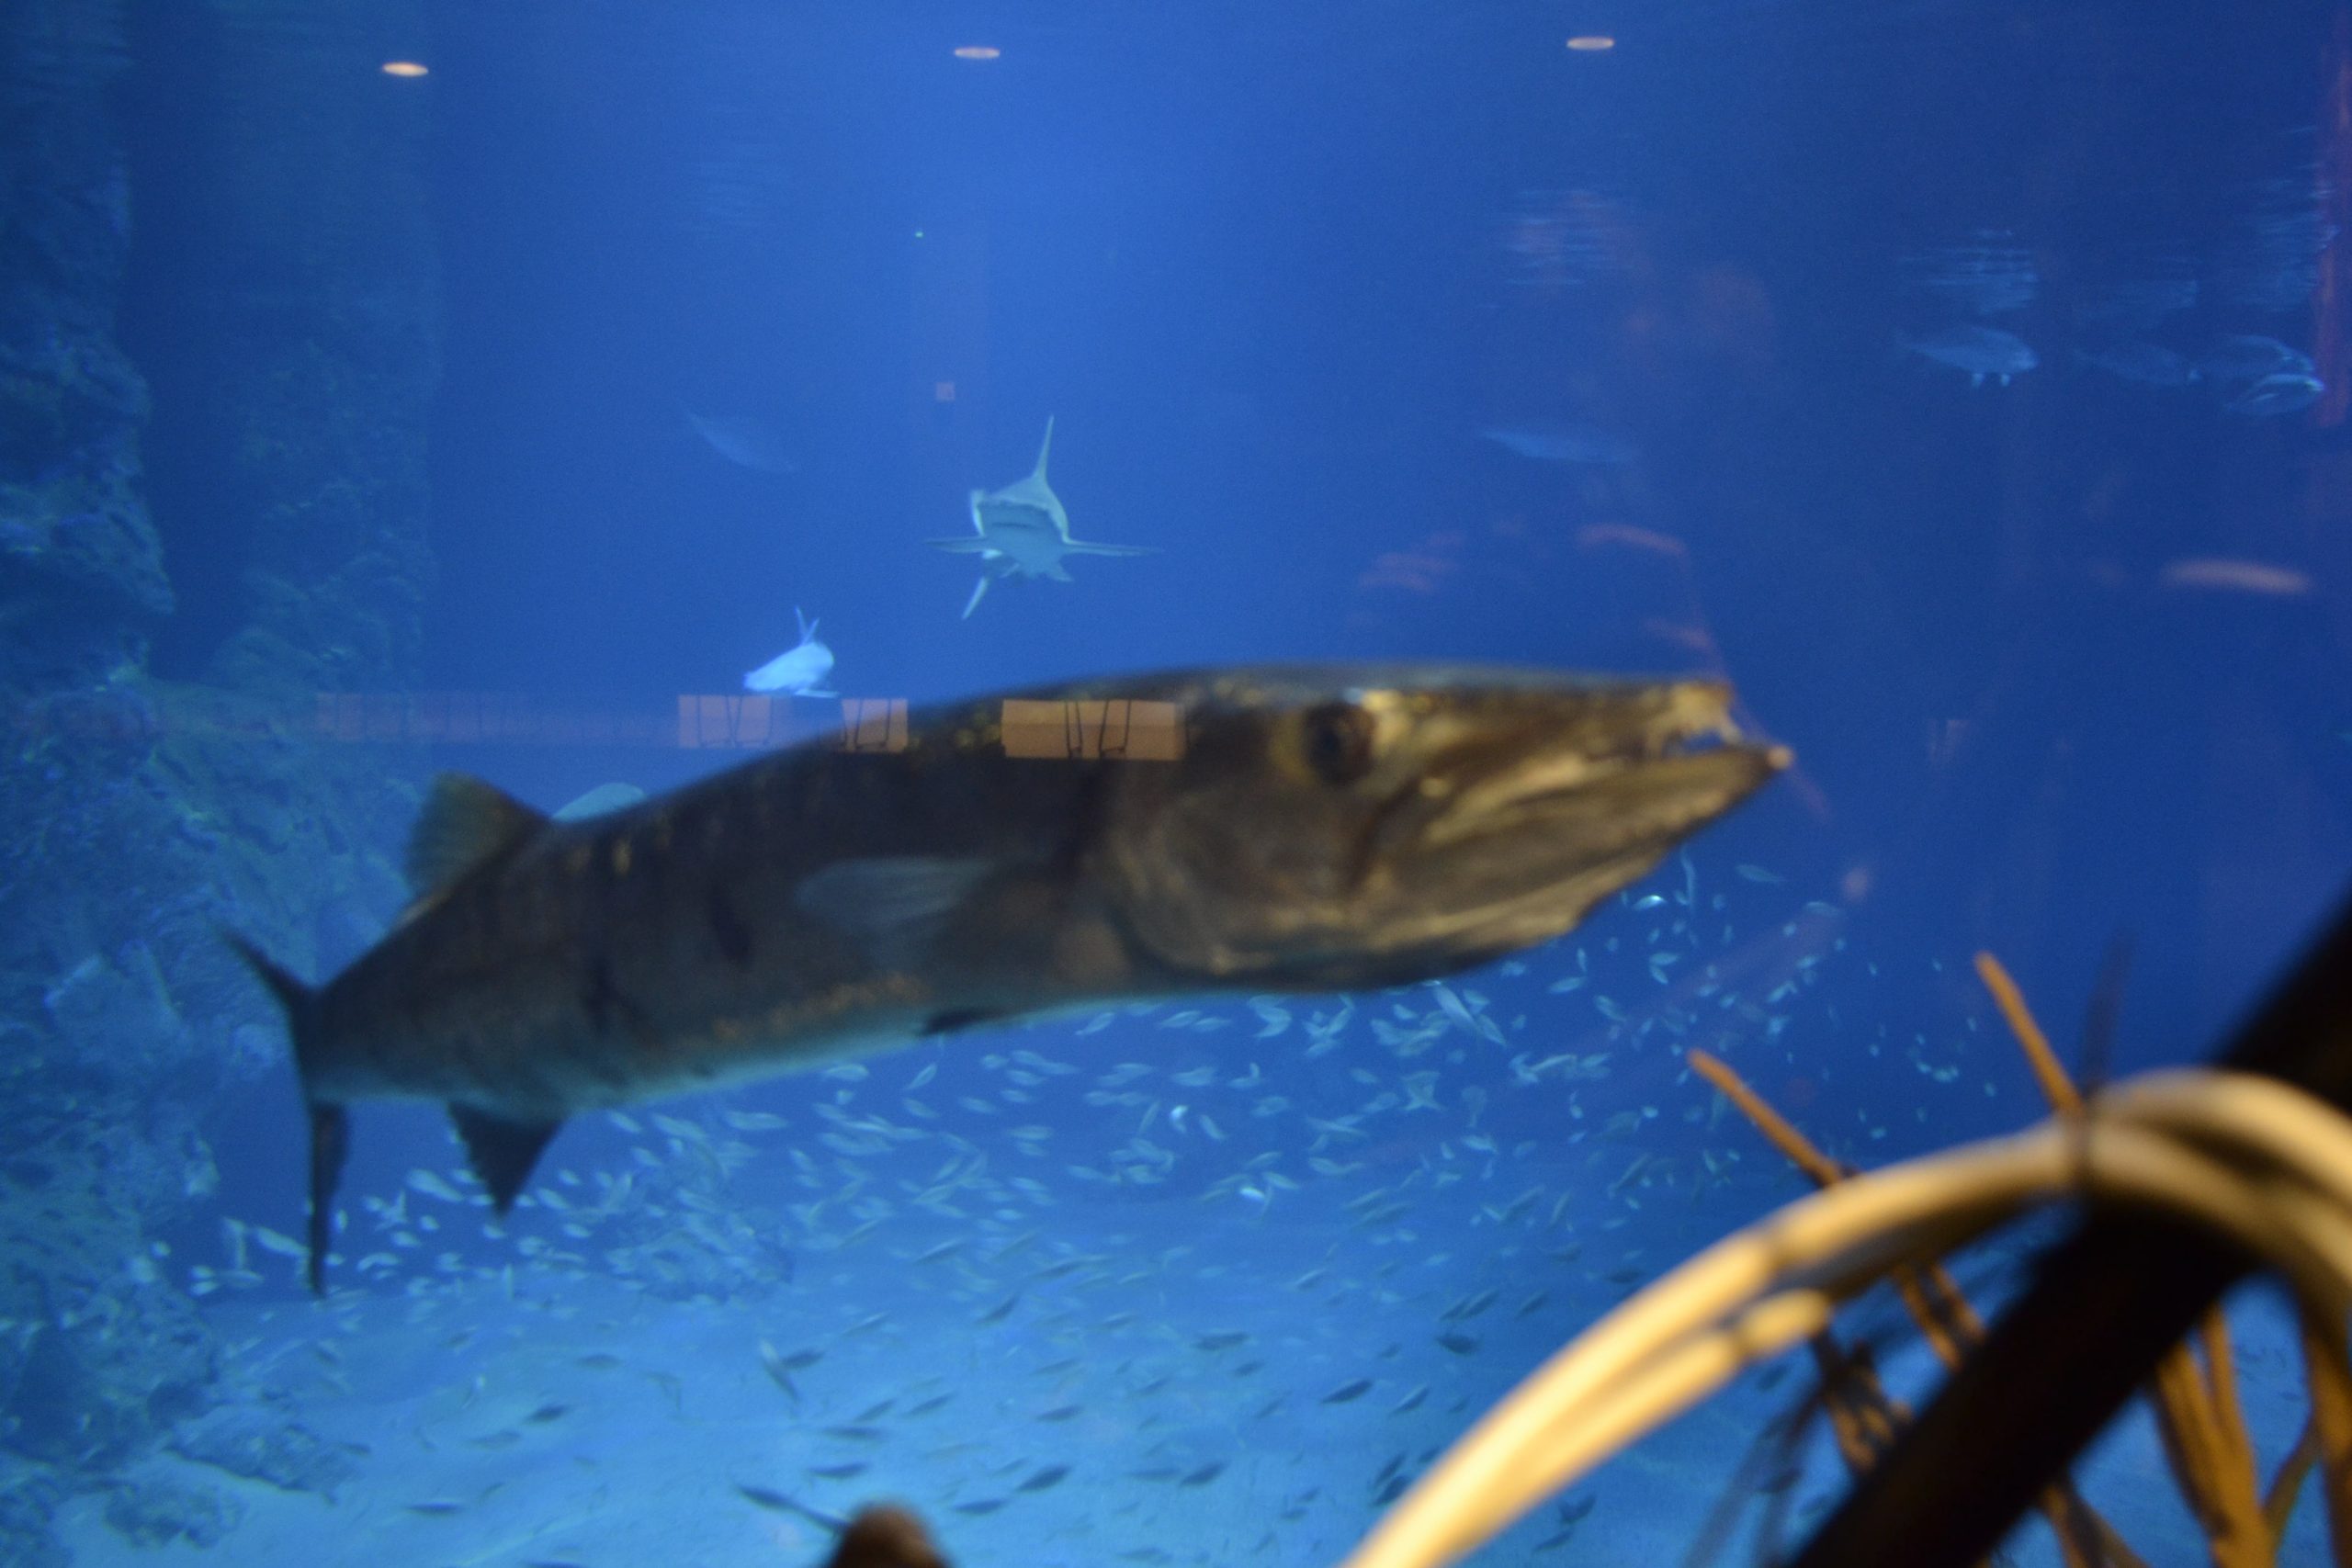 A particularly curious barracuda that had a bad habit of photobombing Muller’s videos, any blinking camera lights had to be covered with tape to quell the fish’s interest. (Photo: Koen Muller)
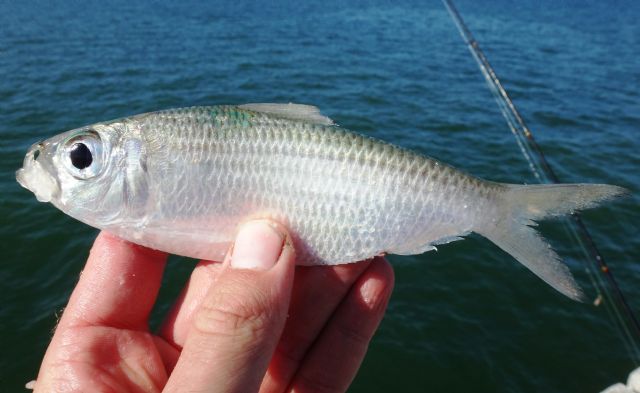 An angler holding a single tiny false herring, giving a sense of ‘scale’. (Photo: Ben Cantrell, specieshunters.com)
Fishpocalypse Now
Another source of error was simply due to the confounding effects of geometric perspective and optical distortion that arise from filming objects arrayed at various distances in water through glass with wide-angle lenses. Thus, some optics expertise is needed to ‘dewarp’ the images. Then, any object viewed by four cameras needs to be ‘triangulated’ to yield an accurate position measurement. Errors can be largely compensated for through careful calibration of the cameras.
But it’s not possible to position a suitable calibration object precisely inside the tank. So Muller had to come up with a way to calibrate the setup using an object much smaller than the measurement space that could be moved. To this end, a door-sized checkerboard grid of 30 x 30 cm plastic tiles was carried through the water by scuba-diving zoo employees, allowing it to be imaged in numerous arbitrary positions with respect to the cameras. Muller managed to get the position measurement accuracy of the setup down to below 1 cm, which was crucial for extracting the trajectories of the fish.
Zoo employees moving the calibration board around in the tank. The diver at the back is not there to skewer any predators, but to keep them away for their own safety; the calibration board has sharp edges. (Video: Koen Muller)
Tracking Nemo
From there things don’t just go swimmingly, the footage recorded by the cameras had to be processed so that individual fish in the school could be identified and continuously tracked in three dimensions. This ‘fish-ial’ recognition required complex noise reduction and manipulation of the data, and there were enormous challenges to be overcome here too.
The illumination of the shark tank was uneven and inconstant, since it was provided by sunlight entering the tank from above through rippling surface waves. Reflections off objects and animals in the tank also played havoc with the lighting. In addition, the contrast in brightness between the bottom and the sides of the tank was large, making it tricky to follow a fish as the background changed. And if that wasn’t enough, camera flashes from visitors taking pictures added yet another source of sporadic ‘noise’ in the recorded data.
Reconstructing the trajectories of thousands of small Harengula in spite of all the difficulties requires some incredible image processing and tracking algorithms. The results can be presented in the form of pictures of the ‘fish tornado’ that first struck Muller.
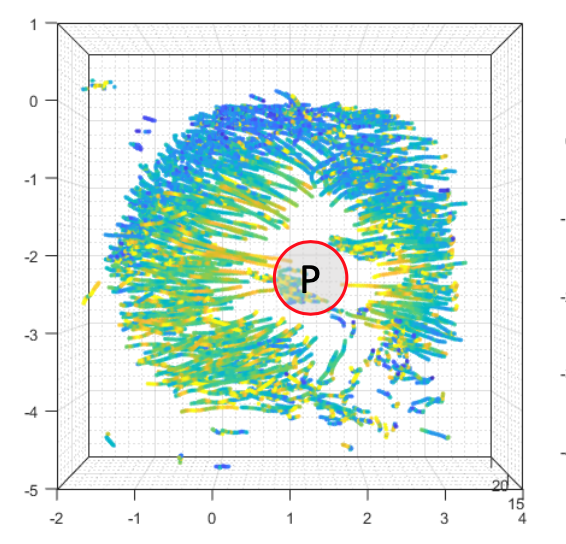
Other fanciful shapes taken on by schools of the fish as they mill around – pancakes, cylinders, and balls – are also depicted, as are the varying forms of their predator-escape responses – donuts and stars.
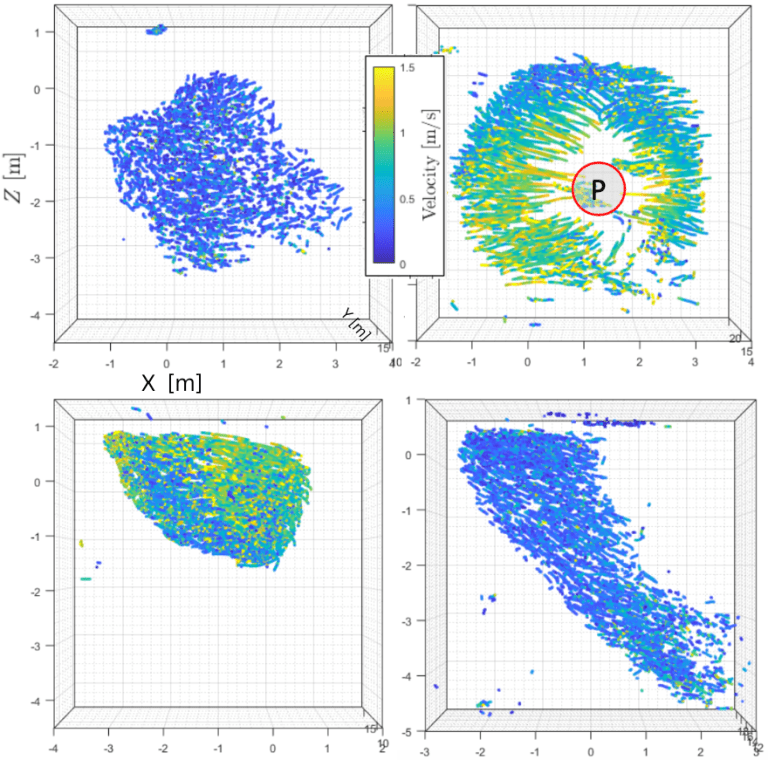
A selection of the visualised data from Muller’s dissertation. These are examples of quantitative imaging of shoaling behaviour (top left), a donut escape-response (top right, P denotes a ‘predator’ position), a ‘fish ball’ milling shape (bottom left), and finally the familiar cylindrical ‘fish tornado’.
Diving into the data
By analysing how these shapes vary over time under given circumstances, Muller finally arrived at what he had set out to obtain: knowledge of how the behavioural rules that govern the motion of individual fish translate into a morphology of fish schools.
His observations confirm what was previously reported in the literature. With no predators around, the fish tended to swim in a counter-current direction, taking on a limited selection of group shapes. When a predator appears, however, the school splits into smaller groups, form protective rings, or plunge downward in unison.
Muller also analysed the distribution and orientation of fish within the school. For example, he noticed that when a fish moved towards the edges of the group, that could signal a predator threat. He also noticed that the school’s polarisation, which measures how aligned the fish are, increased when the fish spread out towards the edges.
Specific results but general methods
Muller’s findings mainly provide quantitative support to what had previously only been described qualitatively. They may prove useful to marine biologists who seek greater rigour in their understanding of schools of fish, or for the fishing industry. But what cannot be denied is that the methods that Muller mustered to acquire and analyse the data can be applied to many other kinds of collective motions of many interacting entities, living and non-living.
Indeed, Muller is currently at work on the outdoor observation of snowfall. Ever one for taking on demanding projects, he explains: “I’m attempting to do the same type of large-scale measurements, not in a zoo environment, but outdoors in the Swiss Alps tracking snowflakes over 20 by 20 metres.” His visits to the Oceanium will stay with him though: “It was the experience of a lifetime.” It certainly sounds like he had a whale of a time.
- If you’re interested in the technical nitty-gritty of the research, Muller’s dissertation is available to read at TU Delft’s repository.
Oscar Greenwell / Editor


Comments are closed.