At the World Sailing Championships in Scheveningen, former world champion Annemiek Bekkering brought the races to shore through TU Delft computer images on a large screen.
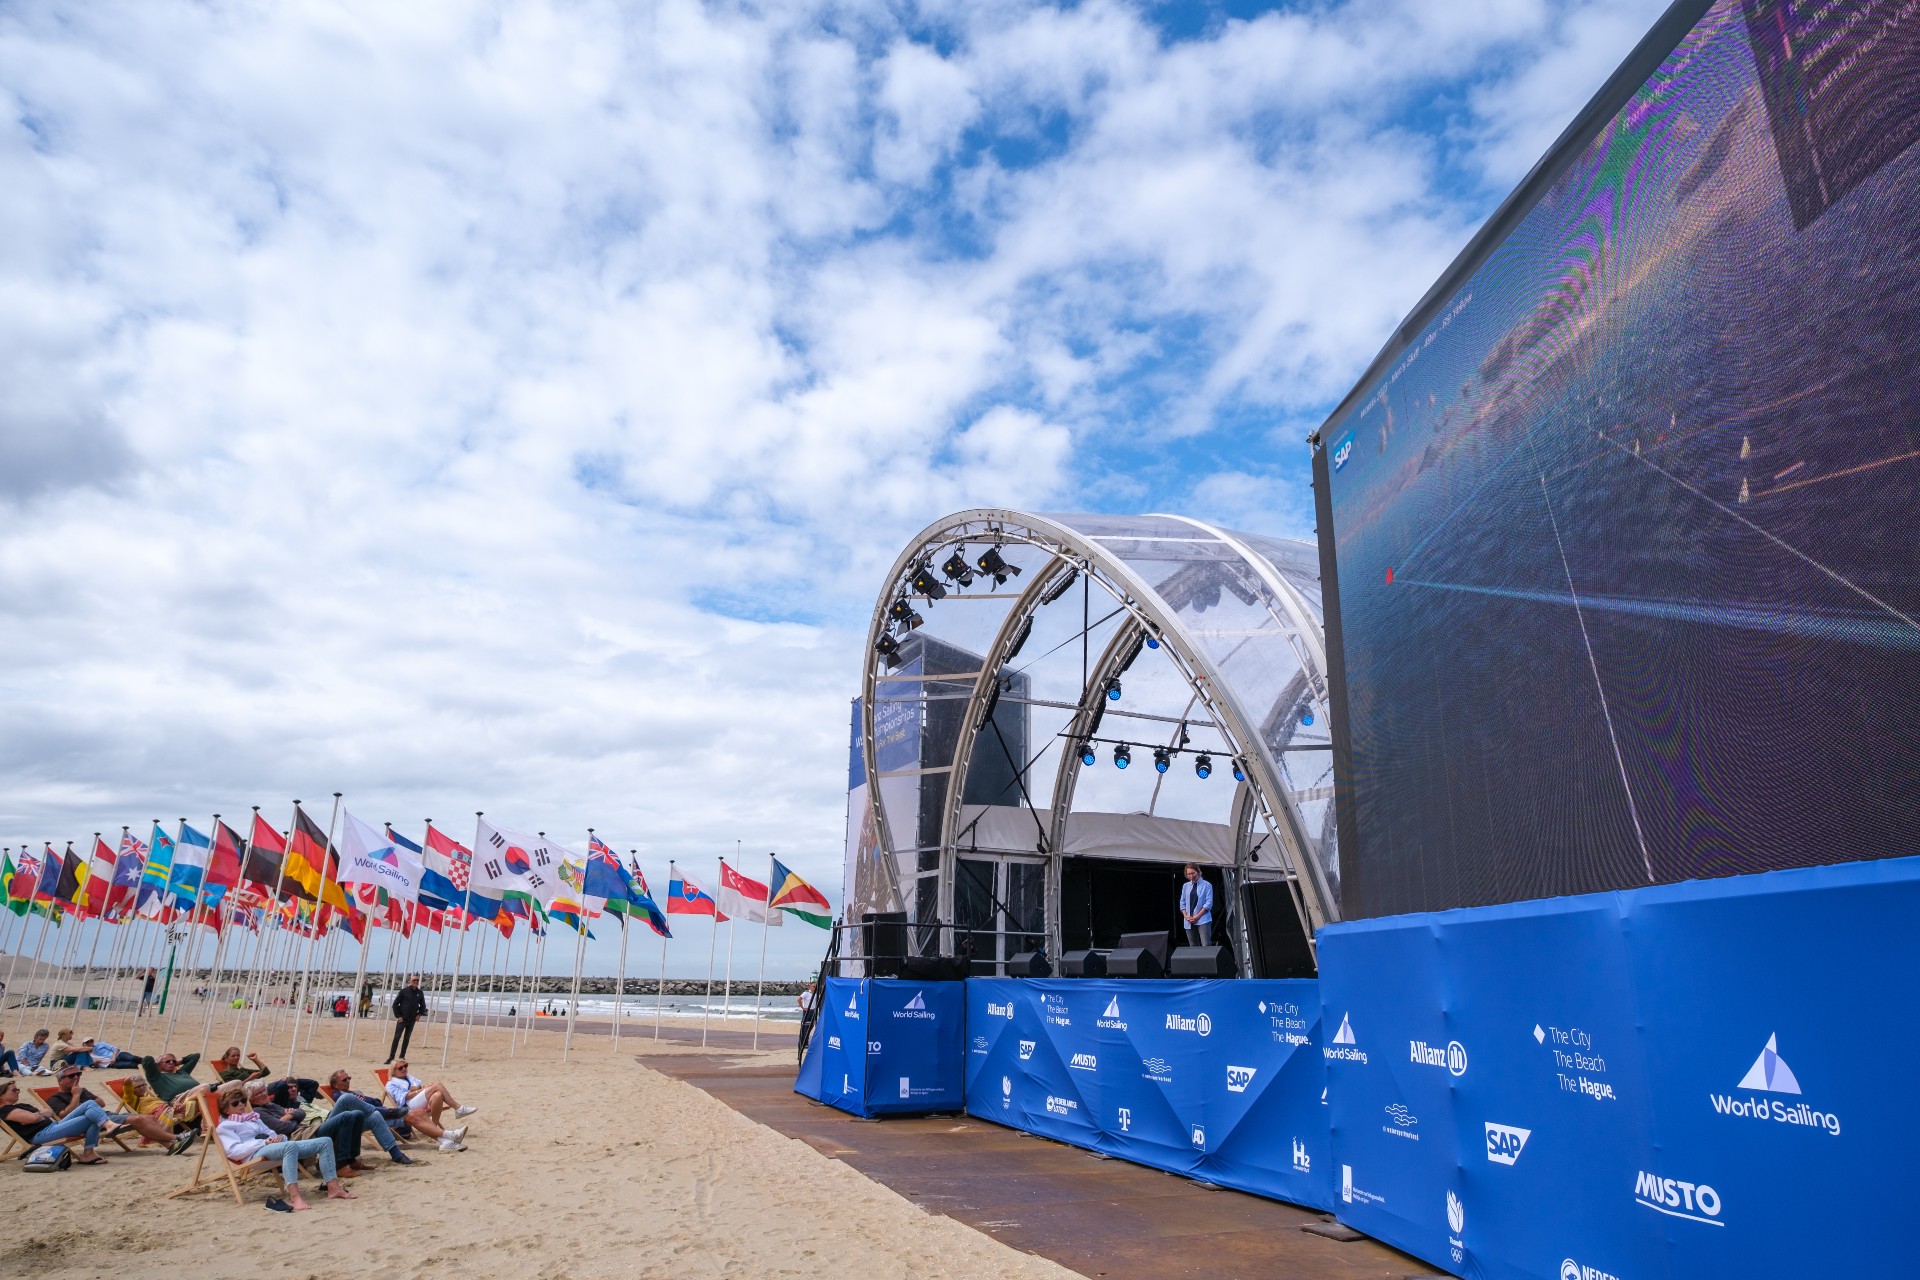
The screen next to the main stage shows the race in detail. (Photo: Allianz World Sailing Championship)
There are not many world championships where you walk in for free and then sit barefoot in a beach chair in warm sand in the front row. The contrast with the Formula 1 races, sometimes held 35 kilometres away through the dunes, could not be greater. There there are crowds, noise and big money. Here, peace, space and real lovers of the sport.
Frankly, there is not much to see either. Just outside the harbour, coloured triangles slowly slide past each other in an unfathomable pattern. Only connoisseurs know the route the boats have to take between the buoys. They know the tactical considerations, and they understand the tension on board and the split-second decisions the sailors have to take in a race. But a kilometre away, the public gets little of that. At least until recently.
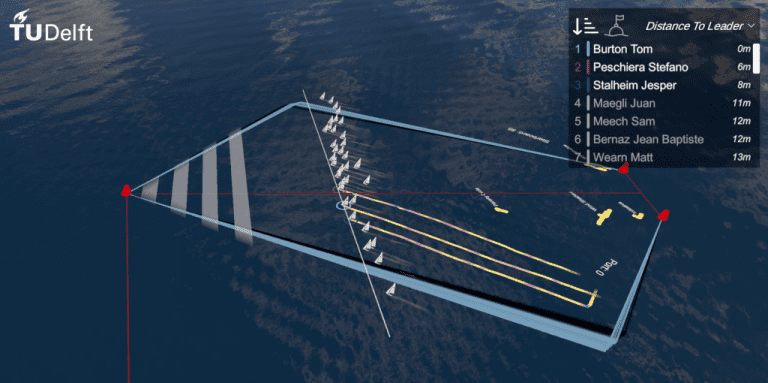
 Image from the SailingPlus app showing a red upwind buoy and corresponding laylines. (Image: TU Delft)
SailingPlus
At the Allianz World Sailing Championships 2023, held in Scheveningen between 10 and 20 August, tournament Director Annemiek Bekkering and windsurfer Dorian van Rijsselberghe presented live sailing races on a big screen showing all the boats. This was the premiere of SailingPlus, the sailing visualisation developed by computer graphics experts from TU Delft and the Sailing Innovation Centre in The Hague.
TU Delft alumnus Nerine Usman was at the buttons. Switching from overviews to close-ups, she conjured up all sorts of statistics and intermediate rankings. As an embedded scientist at the Sailing Innovation Centre, she was closely involved in developing the visualisation.
For the general audience tracker images are too abstract
SAP, one of the Sailing World Cup sponsors, has recorded GPS data from trackers on the boats for about 10 years. SAP also visualises that data in what looks like a group of moving triangles between red dots which represent the buoys. Sailors understand that, but for the wider public it is too abstract.
So about four years ago, the Sailing Innovation Centre started looking for a better visualisation of the GPS data. They ended up with Prof. Elmar Eiseman and Berend Baas from the Computer Graphics and Visualisation group (TU Delft Faculty of Electrical Engineering, Mathematics and Computer Science). This resulted in SailingPlus, which Eiseman said “Will help us solve the frustration of both sailors and spectators. It is unfortunate for the competitors that their efforts sometimes go unseen and that spectators often miss crucial moments during spectacular sailing races. Our app can bridge this gap. By using GPS data, computer graphics and advanced 3D techniques, spectators can experience World Cup sailing in a whole new way.”
(Video: Computer Graphics and Visualisation groep TU Delft)
At first glance, the image already looks more appealing: bobbing 3D ships on a gently undulating sea under a light cloudy sky. The scenery consists of 3D computer graphics in which the sailing boats are placed. From the bow lines perpendicular to the varying wind directions show their positions.
“We wanted to make it more accessible,” Bekkering says, “so we added laylines (downwind course lines from a buoy that are at the limit of a doable upwind sailing course, Eds.). You can choose your own camera angle and follow a particular team while still being able to see the distance to the others.” During the presentation, Bekkering gave a live commentary on the boats’ manoeuvres. As a former racing sailor (gold at the 2018 Sailing World Cup), she knows exactly what is going on all the time and takes the audience through the race. This also helps tremendously in accessibility.
The current version is still an unfinished product
However advanced, the current version of SailingPlus is still an unfinished product, say its developers and the Sailing Innovation Centre. Tournament Director Bekkering would like to enhance the appeal further by adding on-board and drone camera footage for more instant action and live commentary.
Software developer Berend Baas wants to improve the leader board. The programme continuously calculates each boat’s gap to the front. But because the distances between them are sometimes small and they change with every turn of the wind, the leader board changes all the time.
Confetti
“When the boats round a buoy, it is easy to see the order,” says Usman. “But on long stretches between two buoys, it is sometimes guesswork and you are not sure who is ahead. It is difficult to put this into an algorithm. Sometimes the solution then is to turn off the leader board until just before the next buoy.”
No shortage of ideas. But whether SailingPlus can develop further into a public platform for sailing depends on sponsorship or private initiatives. “It is already wonderful that a university and an innovation platform have come this far,” says Bekkering. “But further development is up to someone who can turn it into a product.” She is momentarily distracted when on the big screen a Dutch sailing team crosses the finish line in third place. “Let’s clap guys! Can the app have confetti too?”
– More information is available on the websites of the Department of Computer Graphics , the Sailing Innovation Centre and the Allianz World Sailing Championships.

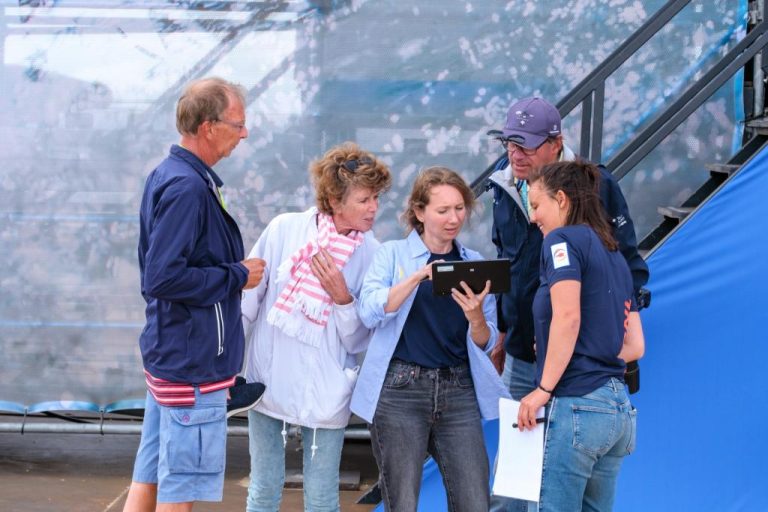
SailingPlus just works on a tablet. Annemiek Bekkering operates the tablet with help from Nerine Usman (Photo: Allianz World Sailing Championships)
Do you have a question or comment about this article?
j.w.wassink@tudelft.nl


Comments are closed.