Never before have ship movements been mapped so completely: from a national overview to a local hub. “You can see how the network functions.”

A registration of 4 months of shipping traffic in The Netherlands based on AIS data has led to the first real navigation map. The more traffic there is, the lighter the colour. (Image: Solange van der Werff) (Image: Solange van der Werff)
Waterway authorities have been interested in AIS data for some time. Just think: almost every ship is equipped with the Automatic Identification System, which sends out a beep at least every six minutes containing data on ship type, size, position, course and speed. The system was developed to improve safety on the water, but now that it has become so widespread, AIS is also suitable for other applications. If you save all AIS bleeps, you know everything about how busy the waterways are, how long ships wait in ports and locks, their speed and the alternative routes they take. That is rich treasure for managers and researchers.
Only – it’s not allowed. That is what Prof. Dr. Ir. Mark van Koningsveld says. His field of expertise within the Faculty of Civil Engineering and Geosciences is ports and waterways. He also works at Van Oord, where he focuses on innovative ecological projects and data use. After the introduction of the General Data Protection Regulation (GDPR; AVG in Dutch), AIS data was no longer allowed to be freely used and shared because it contained personal data about the owners of the vessels – some vessels are also residential. Only after TU Delft concluded an agreement with Rijkswaterstaat (Department of Waterways and Public Works) last year were AIS data, stripped of all personal data, released for research.
Planetary Computer
A research consortium consisting of TU Delft, Deltares and Marin received anonymised ship movements in the Netherlands over a period of 4 months from Rijkswaterstaat: a collection of 4 billion ship positions. This was far too many to process in high resolution. Fortunately, Fedor Baart (TU Delft and Deltares) had a plan. He knew about the Microsoft Planetary Computer – a powerful computing service in the cloud intended for environmentally friendly projects. His application was granted, and the calculations could begin.
Solange van der Werff, PhD student at Van Koningsveld, explained how she broke down the 4 billion ship positions into 20 thousand uploads. And how the Planetary Computer placed each of the 4 billion positions very precisely on the map. In previous visualisations on this scale, ship positions were often ‘summarised’ in pixels of tens of metres. Thanks to the greater computing power, the full detail could now be seen in the visualisation, making it possible to zoom in on very specific details from the overview. In this way, 4 billion dots grew into a unique maritime traffic density map. Van der Werff will never forget her first sight of the result. “That was so cool to see. You see the main shipping routes on the North Sea. You see the ferries crossing to England. Boats sail in very regular patterns for the construction of wind farms, but you can also see exactly where the ferries cross the IJ.”
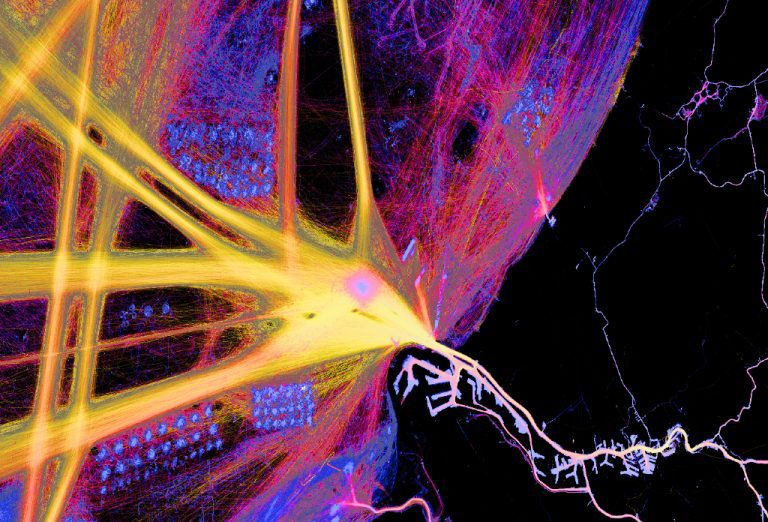
Rotterdam – On the main navigation routes, ships accelerate (yellow lines) and set course for their destination. To the south of the shipping lanes, ships are at anchor. Just outside the harbour mouth, pilot boats are waiting (blue spot in yellow zone). (Image: Solange van der Werff)
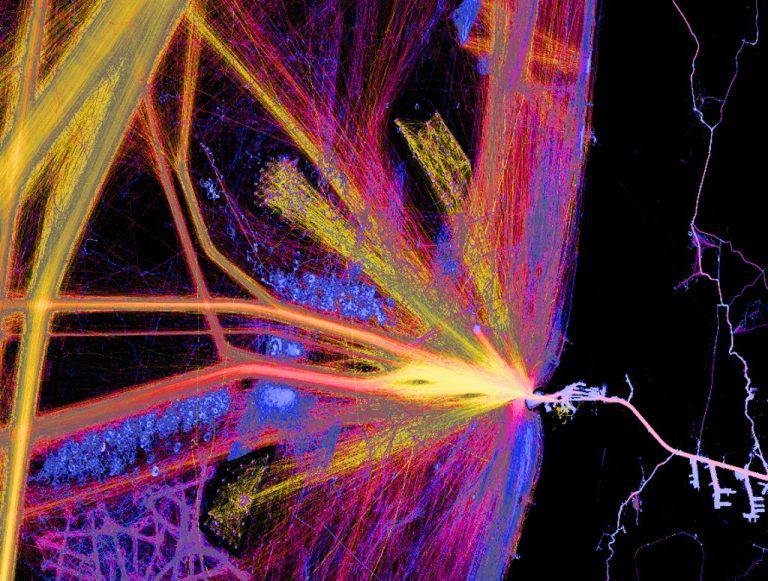
IJmuiden – From IJmuiden, workboats sail at high speed to the wind farms in order to carry out their work there, while hardly moving at all. Sliding between them, the ferry sails north-west to Newcastle. Further offshore, the traffic separation scheme is visible, where ships travel at high speed. (Image: Solange van der Werff)
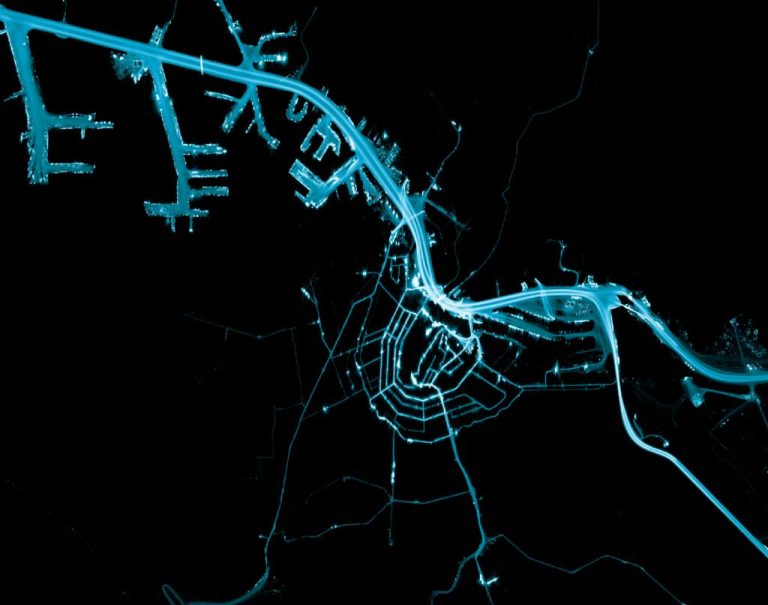
Amsterdam – the IJ at Central Station is the busiest place. Ferries not only sail straight to the other side, but also to the NDSM terrain in the north and the Houthavens on the other side. All of the canals are used, but most intensely in the middle of the city centre. At the Oranjesluizen (east lock), most of the ships turn south into the Amsterdam-Rhine Canal. (Image: Solange van der Werff)
Ships as data
However intriguing the images, the real benefit lies in the data. AIS data have made shipping quantifiable, and can be used in shipping traffic simulations. By linking models and traffic data, waterway managers can look for ways to improve traffic flow, for example around locks. In a simulation with a digital twin of the Dutch waterways, they can study the effects of closing a lock, building a wind farm off the coast or maintenance work.
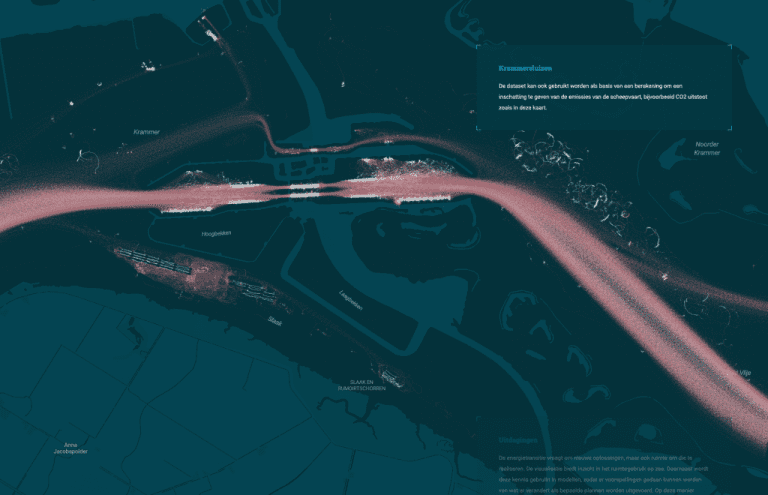
CO2 emissions from ships mapped at the Krammer locks. (Image: Solange van der Werff)
The maritime traffic map is a technological demonstration. Every port authority can make use of it. But will they? Van der Werff expects the first interest to come from the area of CO2 reductions. Like every other institution, ports are under coming under increasing pressure to reduce CO2 emissions. From the combination of AIS data and other data such as current and water depth, the CO2 emissions of a vessel can be calculated and mapped out. Where are they greatest, and what can be done about it? “All these kinds of applications are now possible,” her supervisor agreed.
- – Together with Studio Dirma Janse, the researchers created an interactive tour of the maritime traffic map.
Do you have a question or comment about this article?
[email protected]
Comments are closed.