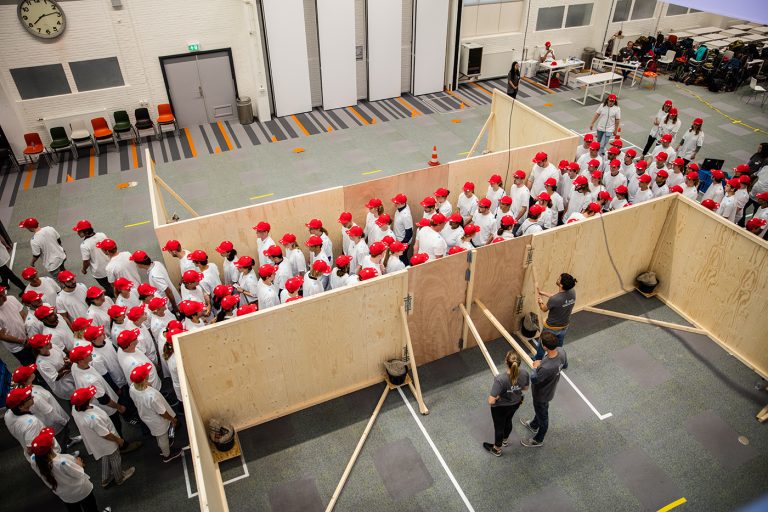
Hundreds of students shuffled through a narrow corridor as a part of a crowd behaviour study last week. Researcher Dr Dorine Duives wanted to know at what point the crowd density would make the flow stop.

Studying the crowd. (Photo: Frank Auperlé/TU Delft)
The Transport and Planning Department at the CiTG Faculty has a long track record in crowd studies. Mathematical models have been built that relate crowd density with speed and flow through narrow corridors, for example. This so-called fundamental diagram is used as a standard in designing railway stations, stadiums or the layout of large events.
“When looking at actual footage of large-scale events, we saw that some things didn’t match the model,” explains researcher Dr Dorine Duives who organised last week’s experiment with her colleague Martijn Sparnaaij. For example, the model predicts a standstill at a certain critical crowd density. But, in reality, even at these densities, people keep shuffling.
“We need to study the transition point more closely,” explains Duives. “The movement does stop, but at higher crowd densities than the model predicts. Perhaps the behavioural rules change at high densities, and we need a different model.”
That was the motive for organising tests with 160 participants on each of two evenings. During the tests, the researchers could run more than a dozen experiments while gradually increasing the crowd density. Each run started with low flowrate and ended with a very high flow rate. To prevent people from walking in regular patterns, some were given instructions to change sides in the corridor so as to disturb the flow.
 (Photo: Frank Auperlé/TU Delft)
There are ways that people cope with increasing crowds, Duives explains. People start squeezing in their shoulders (stage 2); they turn sideways (stage 3); they start touching and pushing one another (stage 4); and eventually they come to a standstill (stage 5).
Duives has about 12 hours of video to analyse when and where the different stages of movement occurred. Computers will convert the video footage into trajectories of individual participants, each of whom can be identified by barcodes on their caps. The next step is then to see which of the hypotheses that the researchers have formulated best matches the data. Processing the data and writing a publication will take about a year, Duives expects.
Do you have a question or comment about this article?
j.w.wassink@tudelft.nl
Comments are closed.